|
|
| Home > Documentation > User's guide > Administration > Administrative Tasks > Administering the Apache Geronimo Server > Performance monitoring |
For monitoring the Web server performance the Monitoring portlet is available by selecting Monitoring on the Console Navigation menu on the left hand side. This feature will allow you to view a number of server statistics on the system JVM, web servers, and information via the AJP protocol. The graph information is provided by the data exposed by the connector MBean.
This article shows one such way of monitoring server information. For this example, we attempt to determine if there is a correlation between the server JVM heap space and the web containers number of bytes downloaded. In other words, this monitoring session will show if the server is releasing heap memory after client downloads. You can create views based on your needs or just using predefined graphs and views in Geronimo 2.1.5
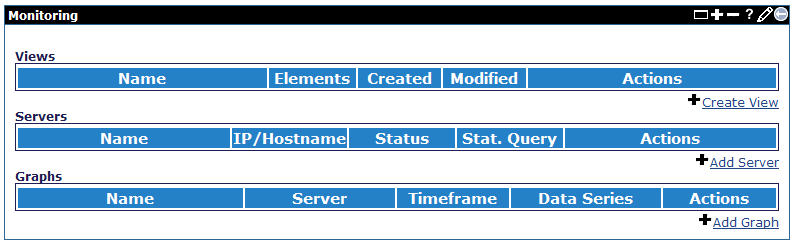
First, select the Monitoring link on the Console Navigation menu. If this is your first monitoring session, you should see an empty set of Servers, Views, and Graphs as shown in this figure.
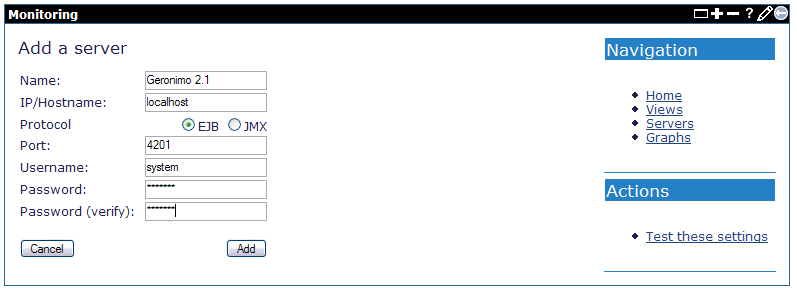
Select a server to monitor by providing a host name or IP address. Select the protocol for communication and any security credentials. Save this server definition by pressing Save.
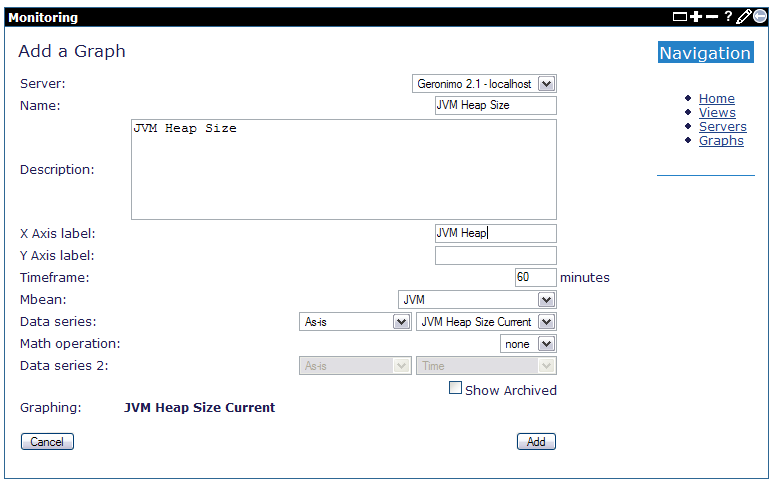
Select information to display by adding a graph. Select the server you are monitoring, and then choose an MBean that publishes server information by choosing an MBean from the MBean drop down control. Once you have selected an MBean, you can see what information is available by selecting data from the Data series drop down control. When you have described the data, save this graph by pressing Save.
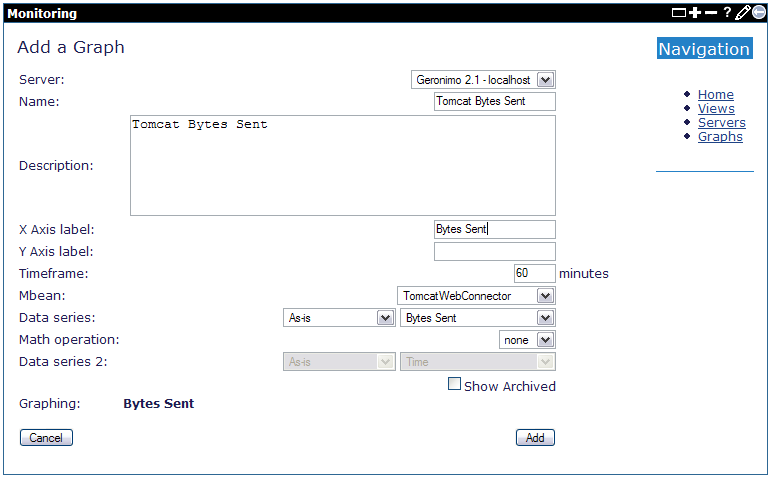
Select more information to display by adding a second graph. As the two data series scroll in time, we will be able to detect any correlation between the data. Once again, choose a server and an MBean to monitor. Select data from the Data series drop down control. Since data sent increases over time, also select delta for the Data series, so we see the rise and fall of the data over time. Save this graph by pressing Save.
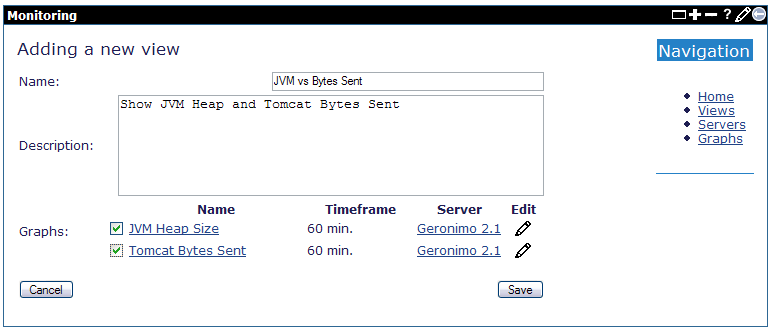
Now group one or more graphs into a view. Here we add a view for "JVM vs Bytes Sent" by selecting two of the graphs we created in earlier steps. Save the view by pressing Save.
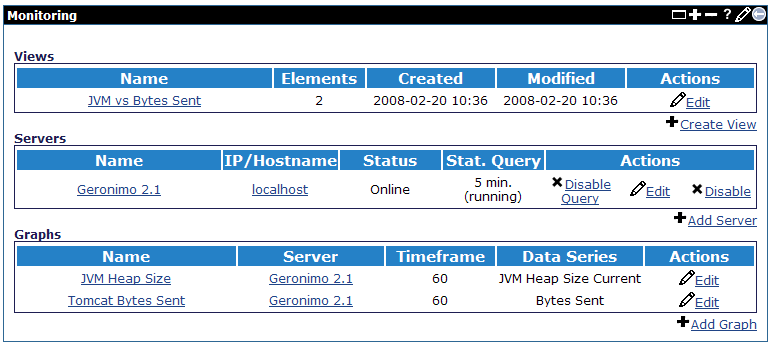
This figure shows the console monitoring portlet after we have added the server, graphs, and views.
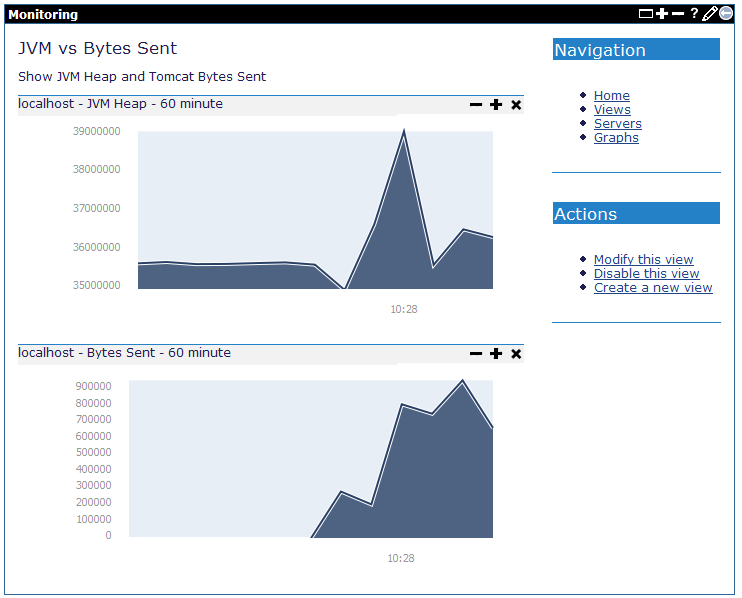
Click on a view to start monitoring server information over time. This view shows the JVM heap and web server bytes sent over a one hour period. As you see in the example, the JVM heap memory goes up and down over time with little correlation to the number of bytes users request from the web server.
Geronimo v2.1.5 provides a set of predefined graphs and views for server monitoring. With the enhancement, a view-only user monitor is created and the user can leverage those graphs and views directly to monitor the health of a server. See Monitoring the server with predefined graphs and views for the details.
|
|
Privacy Policy - Copyright © 2003-2011, The Apache Software Foundation, Licensed under ASL 2.0. |