|
|
| Home > Index > Monitoring and Management Service |
Currently, there is not a good way of surfacing Geronimo's server information so that an administrator can monitor the server's status. The architecture of using MBeans is established, but not fully exploited. This enhancement will take advantage of what Geronimo currently offers and extend it so that a server can tap into a cluster of servers and extract information from specific Geronimo servers or even aggregates of Geronimo servers.
The goal is to have at least one machine be able to reach out to all Geronimo servers in order to fetch data or even alter their state. This will be especially useful in the case of someone having to monitor a large number of Geronimo servers.
As part of the design, there are five major components.
Management Node(s): An instance of Geronimo that has sole purpose of managing and viewing information from Server Nodes, must include admin console.
Management Plugin: Will reside on all Management Nodes and will handle the connection to the Remote Control Plugin to pull relevant information and control the machine.
Connection Information DB: Resides on either a Management Node or a different database server, has Server Name, IP:Port information and remote authentication information for all Server Nodes. Management Nodes use this information to connect to the Server Nodes
Server Node(s): An instance of Geronimo that runs as usual, can be Little G with our MBean and anywhere up from there.
Remote Control Plugin: Will be present on all Server Nodes, handle JSR-77 statistics collection, control the thread which takes snapshots of the server's current state.
The proposed solution would incorporate a scalable design, using the same methods to keep track of statistics and read them locally that it would be pulling them remotely from N machines. This is accomplished by creating a thin layer (Remote Control Plugin) that will work to be a tie-in point for all the statistics, taking a 'snapshot' of the current state of things every X minutes and recording in a database for a predetermined amount of time before there is rollover. With this thin layer serving as a relay point for this data, we can simply connect to it via remote OpenEJB authentication through the Management Plugin, or a different remote machine (i.e. a proposed 'management node') to pull the information, as well as gain control over functions such as simple start/stop/restart, or in the future could be expanded to deploying/uninstalling/redeploying across an entire cluster.
There will not be an active connection from the management node to the server nodes at all times, and will instead be an on-demand connection that will be used only when control or information is requested, resulting in little network overhead.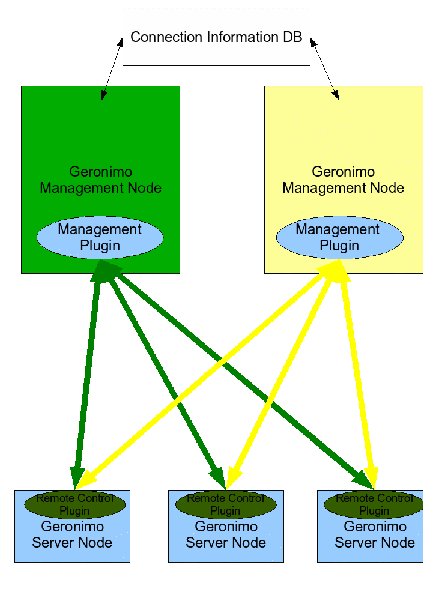
The management plugin resides on the management node, and serves as the user interface for requesting, processing, and then displaying statistical information from the server node(s), as well as providing an interface for a significant degree of control over them, including
There are two methods to collect statistics
The RCP, or collecting agent, will reside on the Server Node and will be in charge of preparing information for the Management Node. Since there are many statistics for different MBeans that the admin could track, we will use the MEJB component that is already implemented in Geronimo to contact these MBeans. 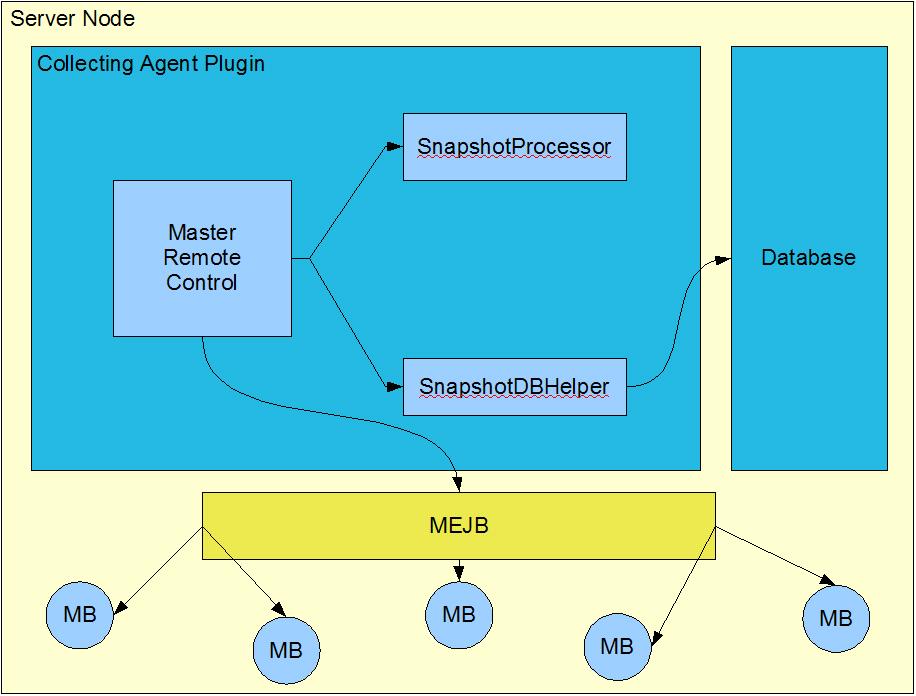
The Master Controller is the collecting agent that will do the managerial tasks such as query the mbeans for their statistics and what not. Additionally, the Master Controller will set timers via the EJB TimerService in order to periodically capture "snapshots." This term will refer to the server's statistics for a given time. With the timers set, we can save the history of the server's statistics. Upon request, the Master Controller will gather all of the information (either by calling MEJB or looking into the server's history stored in a database) and respond by shipping the data back to the Management Node.
Note: All stats will be JSR-77 compliant.
As of now, the collecting agent will create EJB Timers, if it does not already exist, to capture the server's essential information. On each callback the snapshot information on the server itself will be stored to the local database residing on the Server Node. In order to preserve the history, there will be a monthly (default, but can be configured) archive of the server's information stored locally.
There is a second flavor of a collecting agent. The second option is to use pure JMX, bypassing the retrieval of the MEJB mbean in the server. All of the functionality is the same, because EJB timers are replaced with threads. Therefore, stopping a snapshot querying may take longer because of the use of threads as opposed to EJB Timers.
The current architecture of the collecting agent really comes in a pair of plugins (one for the providing the thin layer, and the other for providing that thin layer with a couple datasources). By modularizing these different entities, if the admin would swap out the Datasource with his/her own, the admin could save the snapshot information into any database that is supported by Geronimo. Other examples of notable plugins that use this technique of having a Datasource as a plugin are Jetspeed and Roller.
MBeans
-> id (PK)
-> mbeanName
-> statsNameList
Statistics
-> id (PK)
-> mbeanId (FK references MBeans.id)
-> snapshot_time
-> statsValueList
The values of MBeans.statsNameList and Statistics.statsValueList are CSV strings to represent an MBean's statistics name and value respectively. This is not the final design and will be changed.
|
|
Privacy Policy - Copyright © 2003-2011, The Apache Software Foundation, Licensed under ASL 2.0. |