|
|
| Home > Documentation > User's guide > Monitoring |
The Geronimo monitoring plug-in is broken down between server and client plug-ins, referred to as the 'Agent' and 'Console' respectively. When properly setup, these plug-ins provide both local and remote real-time JSR77 compliant statistic monitoring, as well as historical tracking of any exposed statistic with visual representations drawn in the form of graphs through the Dojo Toolkit's dojoX Charting packages.
The Agent plug-in can be deployed headless on an instance of Geronimo requiring no administrative console able to be polled by the console plug-in from any instance of Geronimo that can communicate with it. There are two flavors of the Agent plug-in available; the first allowing for EJB connections, and the second allowing for JMX connections between the Console and Agent.
While the EJB Agent is the default plug-in installed with the full Java EE 5 assembly of Geronimo, the JMX is recommended for those that otherwise would require no form of EJB in their assembly but still require monitoring ability.
Conversely, the console plug-in, which requires the Geronimo administrative console, can connect to multiple Agent plug-ins across multiple instances of Geronimo, allowing centralized monitoring of statistics on a multitude of machines. The same console is able to connect to either the EJB or the JMX flavor of the Agent plug-in, or even connect to both types on different instances of Geronimo.
From within the Agent plug-in in the administrative console, it is possible to define a connection to any instance of Geronimo that has the Monitoring Agent plug-in deployed. Furthermore, any MBean deployed on the Geronimo instance with the Monitoring Agent that provides statistics can be historically tracked, allowing for graph generation from any statistic element exactly as defined.
Standard behavior of the Monitoring Agent is to take snapshots of the JSR77 defined JVM statistics, as well as the web container statistics for the web container being used (either Jetty or Tomcat). Additional MBeans can be added, or these defaults can be easily removed through the Monitoring Console plug-in.
Currently available statistics:
Generally speaking, the more monitoring that is enabled, the greater impact on overall performance. Following this rule, the more MBeans being tracked by the monitoring plug-in on a given server, the greater the impact. It is generally good practice to limit enabled MBeans to only those that are necessary as opposed to having everything enabled.
Additionally, the monitoring plug-in is in a dormant state when not collecting snapshots. On a default deployment, it will only consume cycles once every 5 minutes.
Both Agent(Server) and Console(Client) plug-ins are pre-installed on the full JEE distributions. If you are using a little-G distribution or customized server assembly and want to leverage Monitoring Plug-ins, you might need to read this section to learn how to install them.
There are two methods for installing the necessary Monitoring Plug-ins. The first (and easiest), is to log into the Geronimo administrative console for the instance of Geronimo onto which the plug-in(s) will be installed, and select 'Plugins' from the left navigation menu.
In the Plugins portlet:
The second method is required if starting from a minimal assembly, or if the Geronimo administrative console is otherwise unavailable.
In terminal:
java -jar deployer.jar search-pluginsOne of the primary goals in developing the monitoring and management plugin was to allow an administrator to monitor any exposed component on any Geronimo server.
The datasources used to communicate to the DB on the server and client side are all packaged into separate plugins. By default, the provided datasources are used to connect an Apache Derby database (the reason for this is because the default DB that Geronimo uses is also Derby). However, since these datasources are packaged as plugins, anyone is able to write their own datasource deployment descriptor, package it into a plugin, and use it instead of the one provided by default. Check the Configuring your own Monitoring Plugin DataSource section for further details.
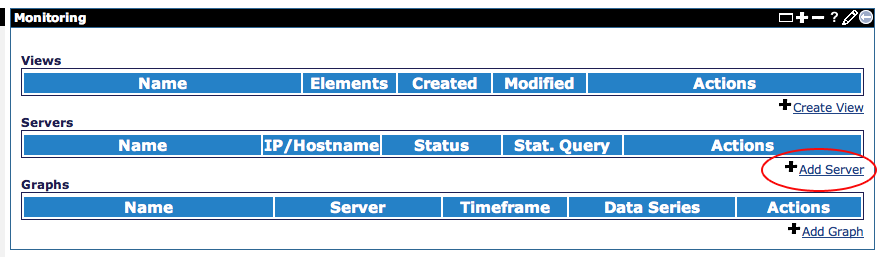
To begin monitoring after the monitoring console has been installed, it is necessary to first add a server. This is done by first selecting the monitoring console from under the Server category in the Geronimo administrative console.
Once in the monitoring console, simply select the Add Server link under the servers category.
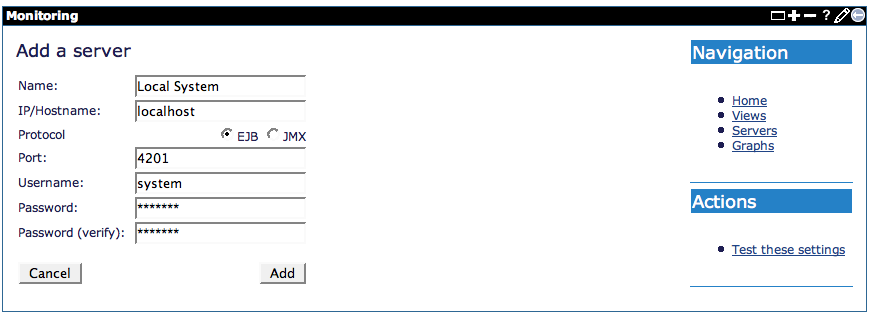
In the Server Add form, fill in the necessary information about the server that is being added as follows and click Add. For example:
agent-car-jmx must be installed and started.)Alternatively, it is possible to test the connection using the information provided via the Test these settings link on the right navigation pane.
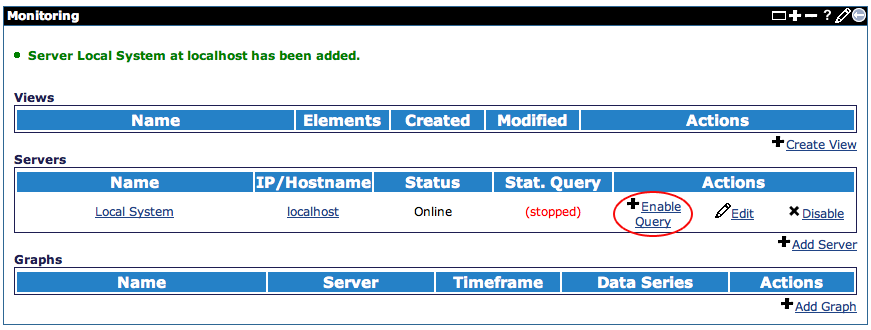
After a server is successfully added, the browser will be redirected to the main monitoring console page, again listing all Views, Servers, and Graphs configured on the console.
If configuring monitoring on a freshly deployed instance of the monitoring agent, it is necessary to click the 'Enable Query' link associated with the added server, which will enable snapshot collection on the default duration of 5 minutes.
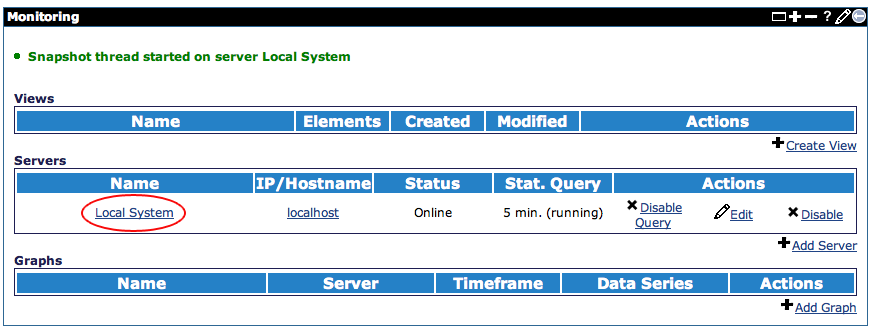
Once the Snapshot querying has been enabled, the monitoring agent will immediately begin taking statistics snapshots on the default interval of 5 minutes. This can be changed by selecting the Edit link associated with the server, otherwise particular statistics being collected can be viewed or changed by selecting the server name.
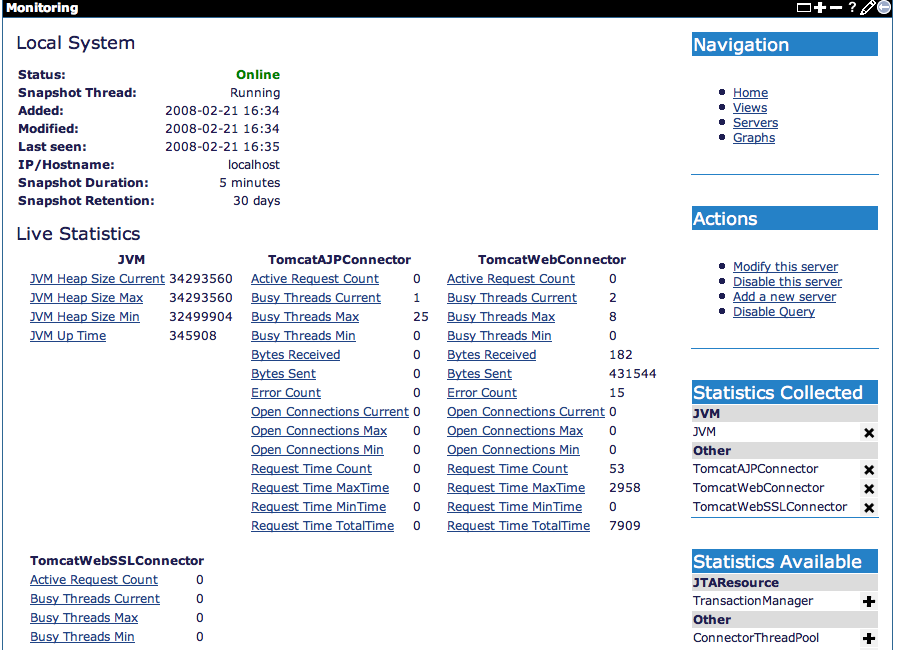
When viewing a server, information such as Status (Online/Offline), Snapshot Thread (running or not), Timestamp for added/last seen/modified, address, Snapshot Duration, and snapshot Retention will be visible.
In addition to this, the bulk of the page is consumed by detailed information on all statistics being monitored by the monitoring agent. Clicking on one of the statistic names will result in a redirection to a graph add page to generate a graph based on that statistic with much if the information already populated.
With the Xs and +s on the right pane of the page, it is possible to either disable or enable (respectively) statistics collection for given MBean.
Administrators using the console are able to create customized graphs. They are able to specify which statistic to be graphed, in addition to the ability to perform a mathematical operation on two statistics.
Graphs can be added for a specific statistic by either selecting the statistic while viewing a server as previously mentioned, or by selecting the Add Graph from the monitoring console main page.
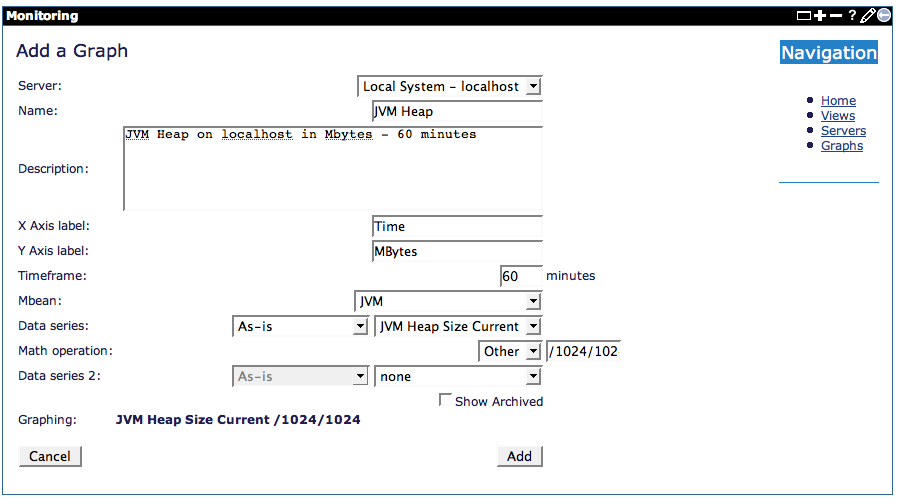
Once on the graph adding page, the server must first be selected, followed by the MBean and the statistic to be graphed, and a Timeframe, which is the duration that will be graphed (most recent 60 minutes, for example). After this, a math operation can be selected from presets (basic addition, multiplication, subtraction or division), or by selecting 'other' to custom define one. Once a math operation is defined (which is optional), an optional secondary statistic can be selected as well.
X and Y axis labels, as well as the description and name must be manually defined.
Once all of this information is provided, simply click Add to add the graph to the database.
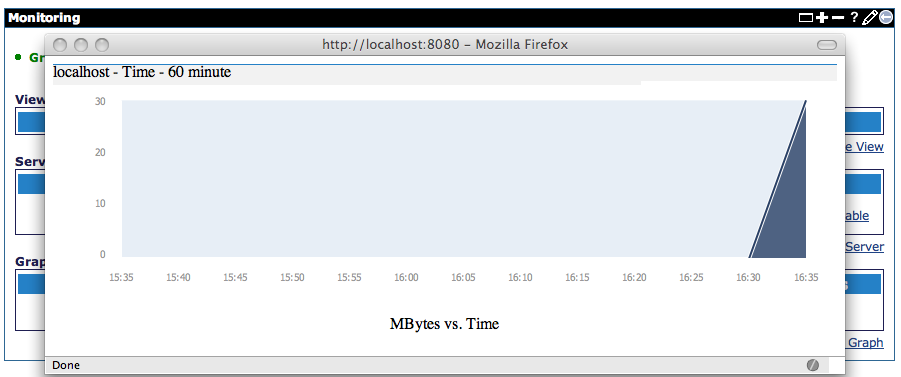
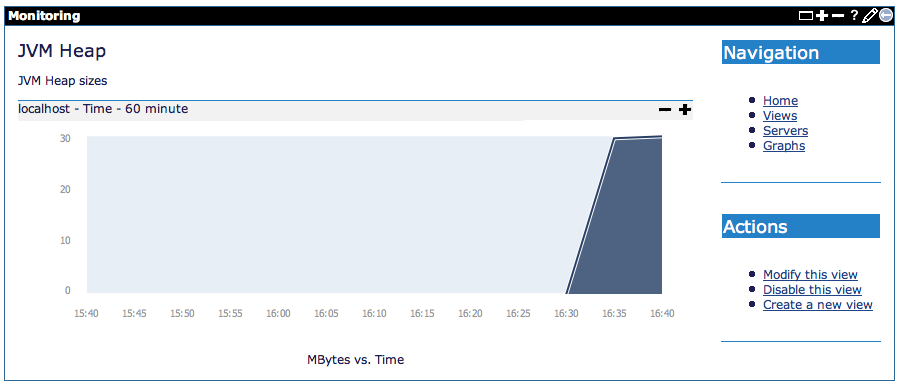
After the graph is added, the browser will be redirected to the main monitoring console page, where selecting the name of the graph will open a pop-up window displaying the graph as follows:
Since there may be many different graphs, the concept of a "view" is used to bundle related graphs together for more manageable use. For example, all graphs related to a specific server can be bundled together, or all graphs graphing the throughput of servers.
To add a view, simply select the Create View link from the monitoring console main page. This will open a form that requires providing a View name, description as well as checking the boxes next to the graphs desired to be incorporated in this view.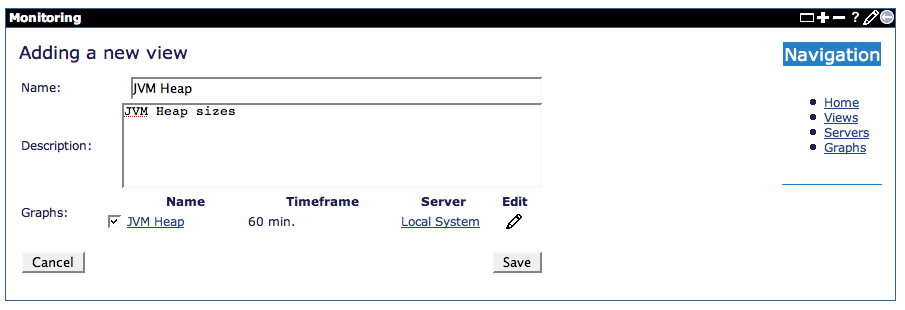
Once complete, simply click save to add the view to the database.
Displaying the view will show all graphs currently in the view on a single page, as well as automatically refresh every 5 minutes.
|
|
Privacy Policy - Copyright © 2003-2011, The Apache Software Foundation, Licensed under ASL 2.0. |