|
|
| Home > Documentation > Configuring and administering > Monitoring the health of the Apache Geronimo server > Monitoring components on Geronimo Server |
The Geronimo monitoring plug-in is broken down between server and client plug-ins, referred to as the 'Agent' and 'Console' respectively. When properly setup, these plug-ins provide both local and remote real-time JSR77 compliant statistic monitoring, as well as historical tracking of any exposed statistic with visual representations drawn in the form of graphs through the Dojo Toolkit's dojoX Charting packages.
Agent (Server) The Agent plug-in can be deployed headless on an instance of Geronimo requiring no administrative console able to be polled by the console plug-in from any instance of Geronimo that can communicate with it. There are two flavors of the Agent plug-in available; the first allowing for EJB connections, and the second allowing for JMX connections between the Console and Agent.
While the EJB Agent is the default plug-in installed with the full JEE5 assembly of Geronimo, the JMX is recommended for those that otherwise would require no form of EJB in their assembly but still require monitoring ability.
Console (Client) The console plug-in, which requires the Geronimo administrative console, can connect to multiple Agent plug-ins across multiple instances of Geronimo, allowing centralized monitoring of statistics on a multitude of machines. The same console is able to connect to either the EJB or the JMX flavor of the Agent plug-in, or even connect to both types on different instances of Geronimo.
From within the Agent plug-in in the administrative console, it is possible to define a connection to any instance of Geronimo that has the Monitoring Agent plug-in deployed. Furthermore, any MBean deployed on the Geronimo instance with the Monitoring Agent that provides statistics can be historically tracked, allowing for graph generation from any statistic element exactly as defined.
Standard behavior of the Monitoring Agent is to take snapshots of the JSR77 defined JVM statistics, as well as the web container statistics for the web container being used (either Jetty or Tomcat). Additional MBeans can be added, or these defaults can be easily removed through the Monitoring Console plug-in.
Currently available statistics:
Generally speaking, the more monitoring that is enabled, the greater impact on overall performance. Following this rule, the more MBeans being tracked by the monitoring plug-in on a given server, the greater the impact. It is generally good practice to limit enabled MBeans to only those that are necessary as opposed to having everything enabled.
Additionally, the monitoring plug-in is in a dormant state when not collecting snapshots. On a default deployment, it will only consume cycles once every 5 minutes.
Both Agent(Server) and Console(Client) plug-ins are pre-installed on the full JEE distributions. If you are using a little-G distribution or customized server assembly and want to leverage Monitoring Plug-ins, you might need to read this section to learn how to install them.
There are two methods for installing the necessary Monitoring Plug-ins. The first (and easiest), is to log into the Geronimo administrative console for the instance of Geronimo onto which the plug-in(s) will be installed, and select 'Plugins' from the left navigation menu.
In the Plugins portlet:
The second method is required if starting from a minimal assembly, or if the Geronimo administrative console is otherwise unavailable.
In terminal:
java -jar deployer.jar search-pluginsOne of the primary goals in developing the monitoring and management plugin was to allow an administrator to monitor any exposed component on any Geronimo server.
The datasources used to communicate to the DB on the server and client side are all packaged into separate plugins. By default, the provided datasources are used to connect an Apache Derby database (the reason for this is because the default DB that Geronimo uses is also Derby). However, since these datasources are packaged as plugins, anyone is able to write their own datasource deployment descriptor, package it into a plugin, and use it instead of the one provided by default. Check the Configuring your own Monitoring Plugin DataSource section for further details.
For monitoring the Web server performance the Monitoring portlet is available by selecting Monitoring on the Console Navigation menu on the left hand side. This feature will allow you to view a number of server statistics on the system JVM, web servers, and information via the AJP protocol. The graph information is provided by the data exposed by the connector MBean.
In this example, we attempt to determine if there is a correlation between the server JVM heap space and the web containers number of bytes downloaded. In other words, this monitoring session will show if the server is releasing heap memory after client downloads.
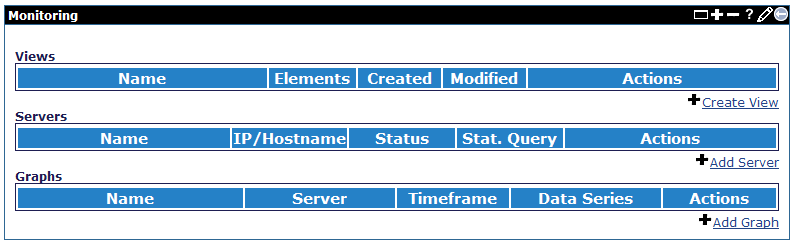
First, select the Monitoring link on the Console Navigation menu. If this is your first monitoring session, you should see an empty set of Servers, Views, and Graphs as shown in this figure.
Select a server to monitor by providing a host name or IP address. Select the protocol for communication and any security credentials. Save this server definition by pressing Save.
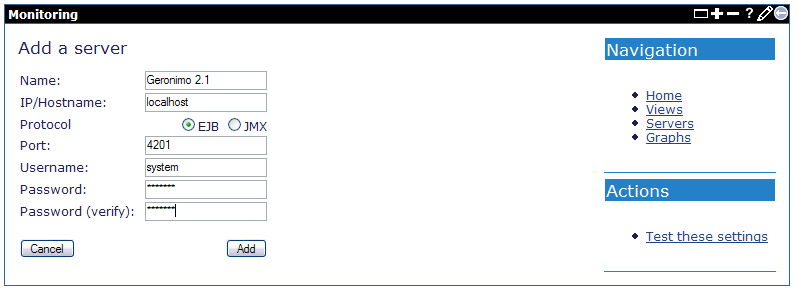
Fill in the fields, and click Add. For example:
agent-car-jmx must be installed and enabled.)Alternatively, it is possible to test the connection using the information provided via the Test these settings link on the right navigation pane.
After a server is successfully added, the browser will be redirected to the main monitoring console page, again listing all Views, Servers, and Graphs configured on the console.
If configuring monitoring on a freshly deployed instance of the monitoring agent, you need to click the Enable Query link associated with the added server. This will enable snapshot collection on the default duration of 5 minutes.
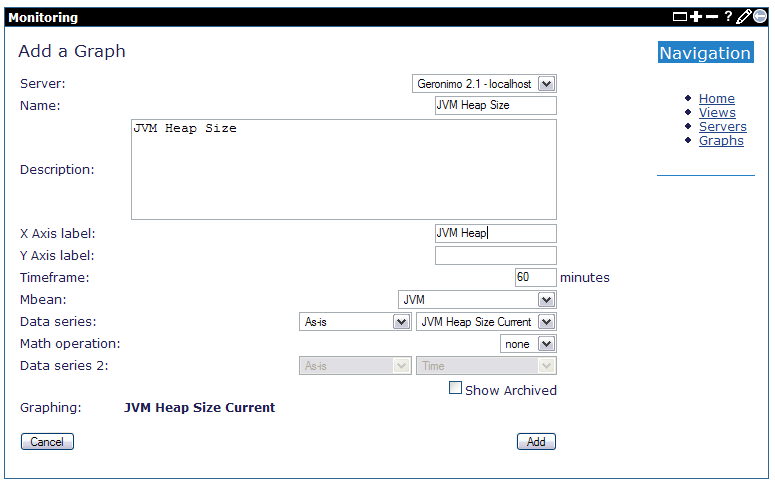
Select information to display by adding a graph. Select the server you are monitoring, and then choose an MBean that publishes server information by choosing an MBean from the MBean drop down control. Once you have selected an MBean, you can see what information is available by selecting data from the Data series drop down control. When you have described the data, save this graph by pressing Save.
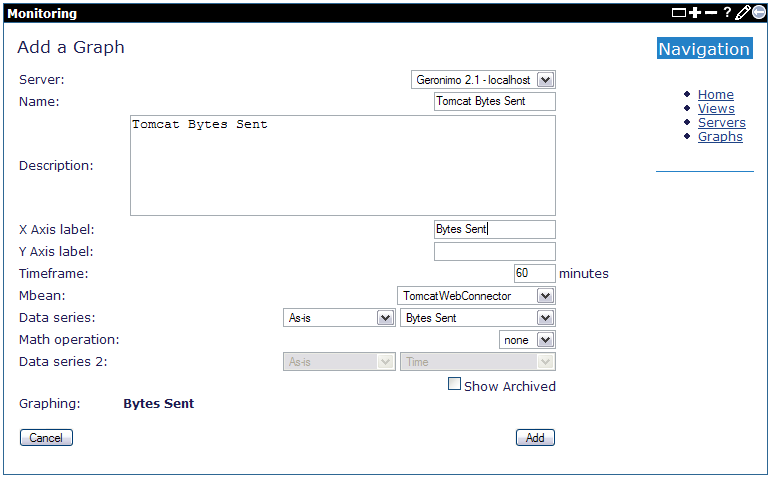
Select more information to display by adding a second graph. As the two data series scroll in time, we will be able to detect any correlation between the data. Once again, choose a server and an MBean to monitor. Select data from the Data series drop down control. Since data sent increases over time, also select delta for the Data series, so we see the rise and fall of the data over time. Save this graph by pressing Save.
After the graph is added, the browser is redirected to the main monitoring console page, where selecting the name of the graph will open a window that displays the graph.
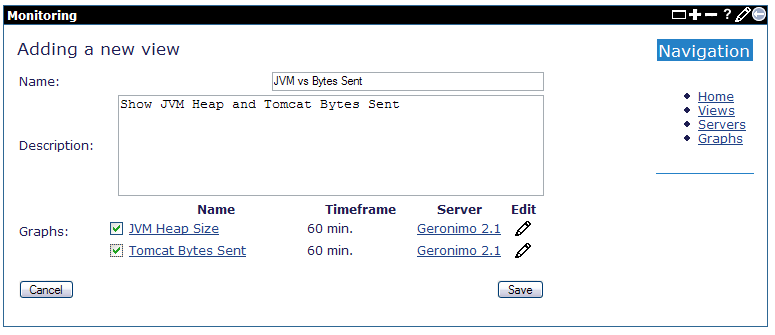
Now group one or more graphs into a view. Here we add a view for "JVM vs Bytes Sent" by selecting two of the graphs we created in earlier steps. Save the view by pressing Save.
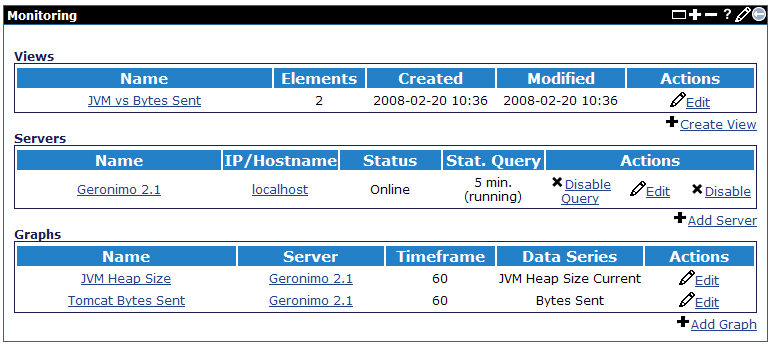
This figure shows the console monitoring portlet after we have added the server, graphs, and views.
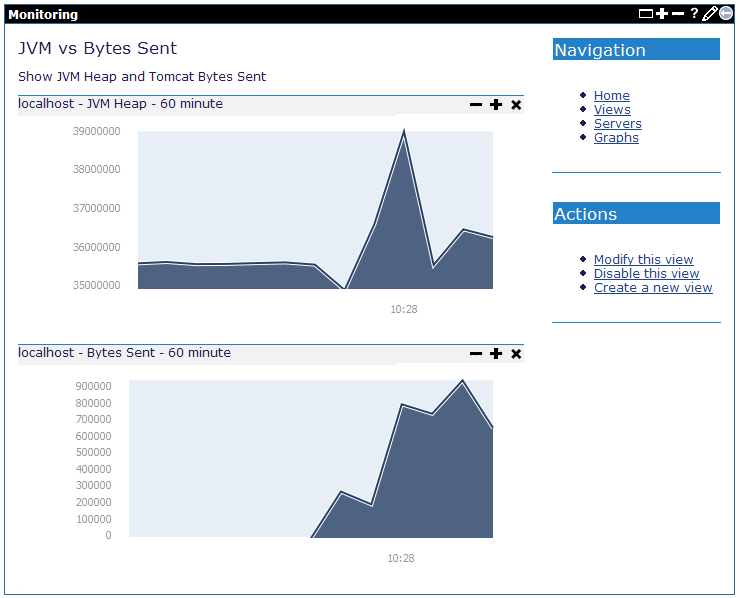
Click on a view to start monitoring server information over time. This view shows the JVM heap and web server bytes sent over a one hour period. As you see in the example, the JVM heap memory goes up and down over time with little correlation to the number of bytes users request from the web server.
|
|
Privacy Policy - Copyright © 2003-2011, The Apache Software Foundation, Licensed under ASL 2.0. |