
|
| Home > Documentation > Configuring and administering > Monitoring the health of the Apache Geronimo server > Configuring log level > Server Log Viewer |
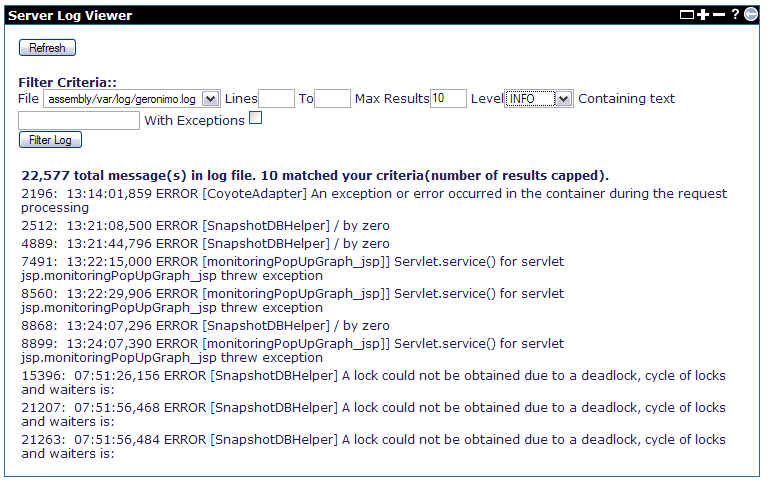
The Server Log Viewer portlet options are illustrated in the following figure. From this portlet you can view the Geronimo server logs as well as set filters for refining the results displayed.

The Refresh link on the upper left corner will reset any filtering criteria you may have specified to the Introducing Geronimo Administration Console's defaults and will display the last 10 lines (if any) of the current Geronimo server log.
The Filter Results: area will let you specify different filtering criteria to further narrowing down your search. The File pull-down menu allows you to select the log file to view. The logs listed in this pull-down menu are ruled by the Configuration File (server-log4j.properties by default) specified in the Log Manager portlet. The number of log files to choose from the File pull-down menu will depend on the number of log files defined in the server-log4j.properties configuration file.
Lines ..to.. lets you specify a range of line of log to analyze. Max Results limits the number of lines to be displayed. Level displays only those errors occurred for that Log Level. Containing text lets you enter a specific string to search through the server log. With Exceptions by clicking this checkbox will be displayed not just the error but also the exception, the stack trace display will be limited to the number lines set by the Max Results value.
|
|
Privacy Policy - Copyright © 2003-2011, The Apache Software Foundation, Licensed under ASL 2.0. |